Metrics for Regression and Classification
Regression Metrics
For regression tasks, no single metric is always best. Each one emphasizes a different kind of error.
| Metric | Main idea | When it helps |
|---|---|---|
| MAE | Average absolute error | Easy to interpret, robust to a few large misses |
| RMSE | Square root of average squared error | Penalizes large errors more strongly |
| MAPE | Average percentage error | Useful when relative error matters, but unstable near zero |
| \(R^2\) | Fraction of variance explained | Good for model comparison, especially in regression baselines |
Some time-series tasks also use MASE or sMAPE, especially when scale-free comparison across series matters.
Classification Starts with the Confusion Matrix
For classification, many common metrics are derived from one table:
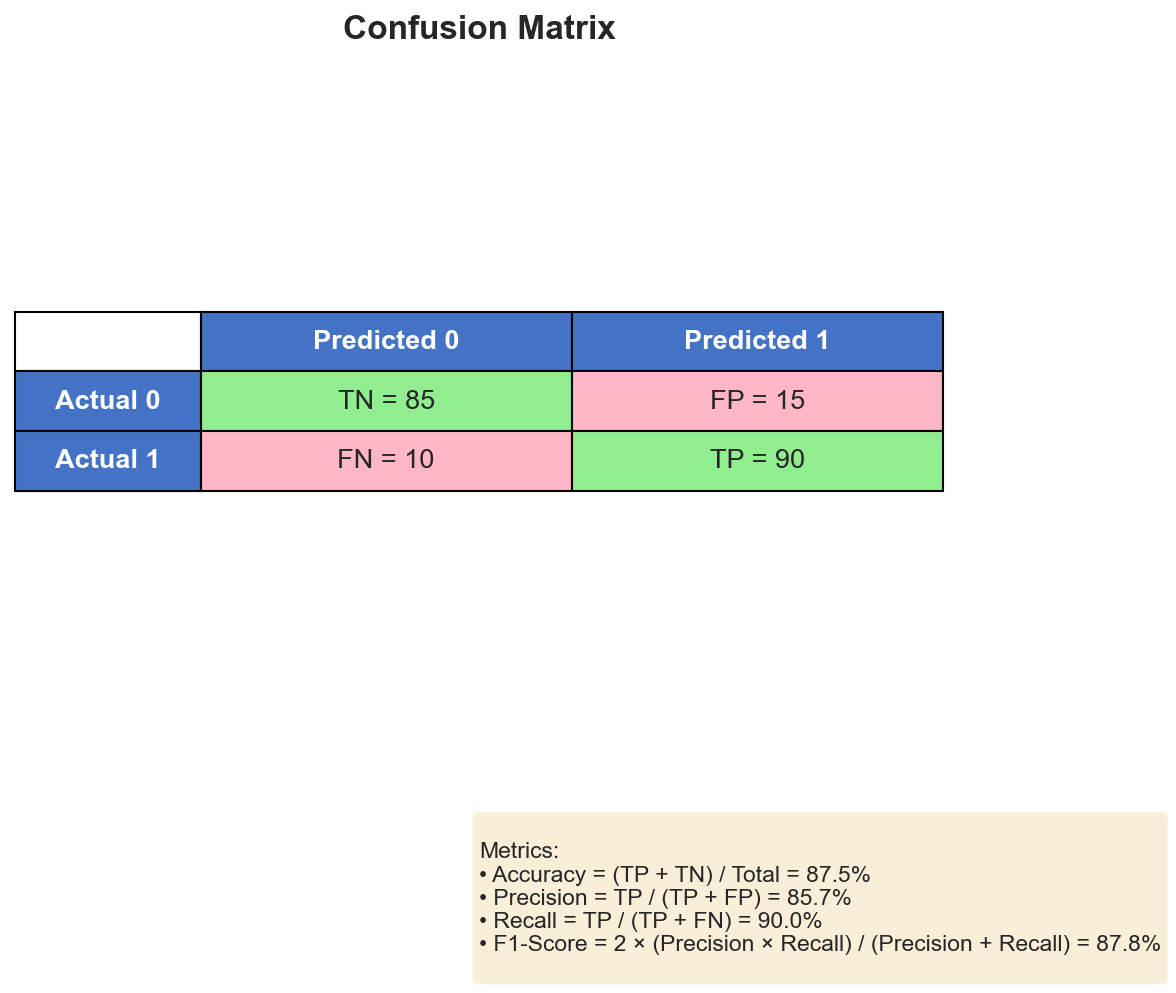
From the confusion matrix we obtain:
\[ \mathrm{Accuracy} = \frac{TP + TN}{TP + TN + FP + FN} \]\[ \mathrm{Precision} = \frac{TP}{TP + FP}, \qquad \mathrm{Recall} = \frac{TP}{TP + FN} \]\[ \mathrm{Specificity} = \frac{TN}{TN + FP}, \qquad F_1 = \frac{2 \cdot \mathrm{Precision} \cdot \mathrm{Recall}}{\mathrm{Precision} + \mathrm{Recall}} \]These metrics answer different questions:
- Precision asks: when we predict positive, how often are we right?
- Recall asks: how many of the true positives did we recover?
- Specificity asks: how well do we reject negatives?
Threshold-Free and Ranking Metrics
When a classifier outputs scores or probabilities, we often care about its ranking ability across many thresholds.
ROC Curve and AUC
The ROC curve plots true positive rate against false positive rate as the threshold moves.
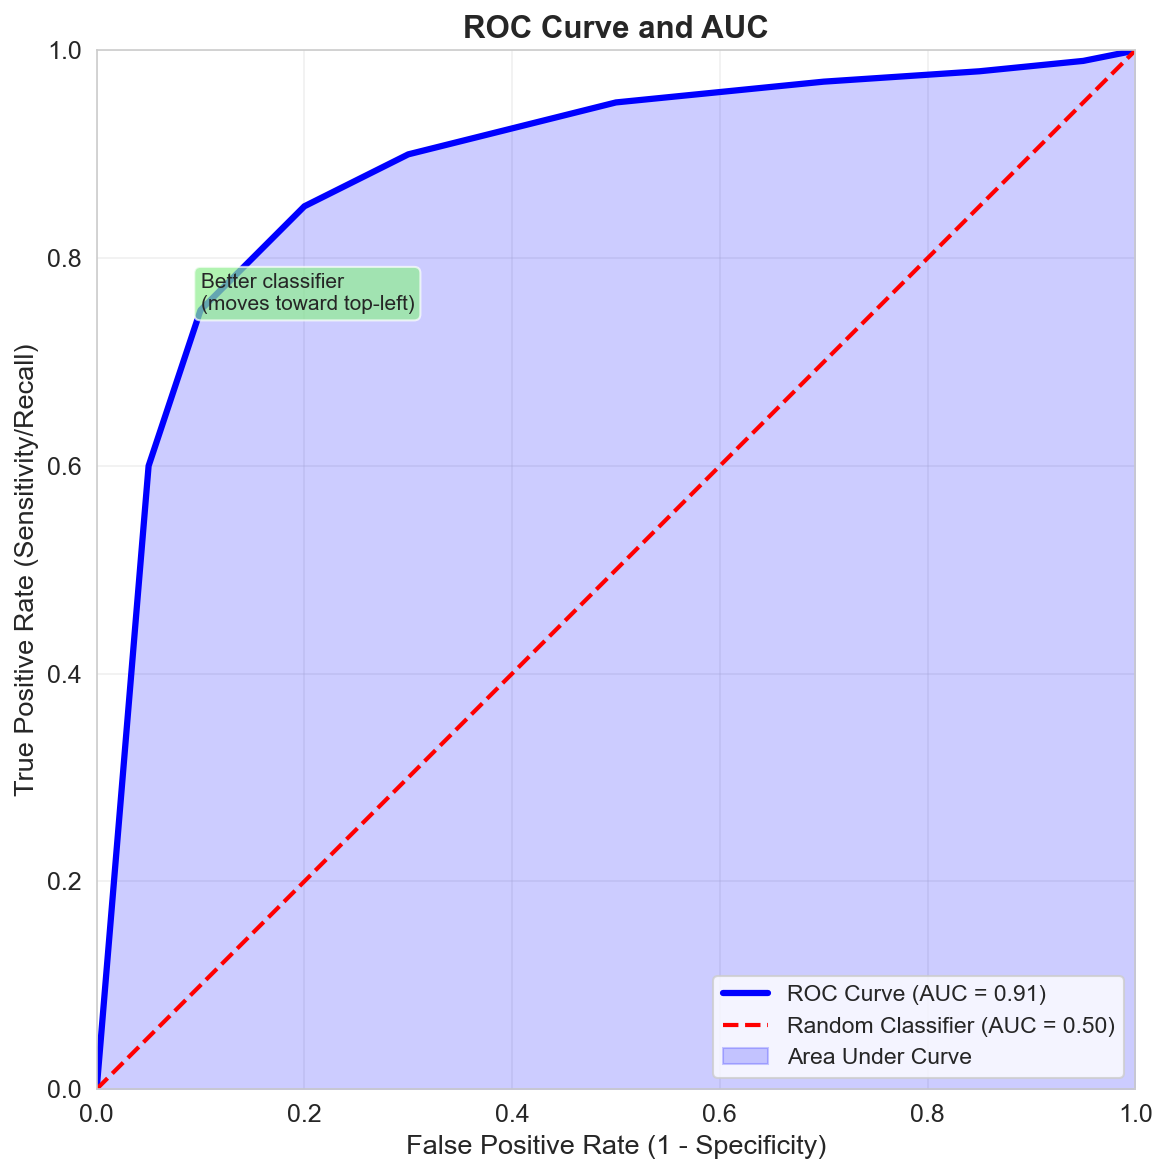
The AUC summarizes that curve:
- \(AUC = 1\): perfect ranking
- \(AUC = 0.5\): random ranking
Gain, Lift, and KS
For credit scoring, marketing, or risk ranking, it is also common to inspect:
- Gain charts: how many positives are captured in the top-ranked fraction of cases
- Lift charts: how much better a ranking is than random selection
- KS statistic: how far apart the positive and negative score distributions are
These are especially useful when the model will be used to rank cases, not just assign a class label at 0.5.
Domain-Specific Metrics
Some tasks need specialized metrics:
- BLEU / ROUGE for language generation or summarization
- IoU for segmentation and object detection
- MAP / Average Precision for retrieval and ranking
The metric should reflect the actual objective of the problem, not just what is convenient to compute.
Best Practices When Choosing Metrics
- Match the metric to the cost of errors in the real task.
- Use more than one metric when one number hides trade-offs.
- Be careful with accuracy on imbalanced data.
- Pair metrics with plots when possible; they often reveal failure modes faster than a single score.
Summary
In this lesson we covered:
- The main regression metrics and what each one emphasizes
- The confusion matrix as the source of many classification metrics
- Precision, recall, specificity, and F1
- ROC curves and AUC for threshold-free comparison
- Ranking metrics such as gain, lift, and KS
- Why specialized domains often need specialized metrics
Next: We will replace the fragile one-shot split with cross-validation strategies that produce more reliable estimates.